One schedule, competing priorities
Using fewer workers, distributing tasks evenly and avoiding long gaps between jobs can pull a schedule in different directions. I investigated how a multi-objective genetic algorithm could produce a range of feasible alternatives for the Shift Minimisation Personnel Task Scheduling Problem (SMPTSP).
I used OR-Library benchmark files containing job timings and worker qualifications. In my implementation, the shift-count measure counts workers assigned at least one job. Fairness measures the standard deviation of task counts; idle time captures gaps between a worker's assigned tasks.
What I implemented
This was an individual implementation and experimental study. I encoded schedules, implemented evolutionary search, maintained an external archive, and produced CSV outputs and plots for analysis.
- Data handling: parse benchmark workers, jobs, timing windows and eligibility information from
.datfiles. - Search: implement parent selection, crossover, mutation and non-dominated candidate selection.
- Constraint handling: use worker qualifications when generating and mutating assignments, and penalise qualification violations.
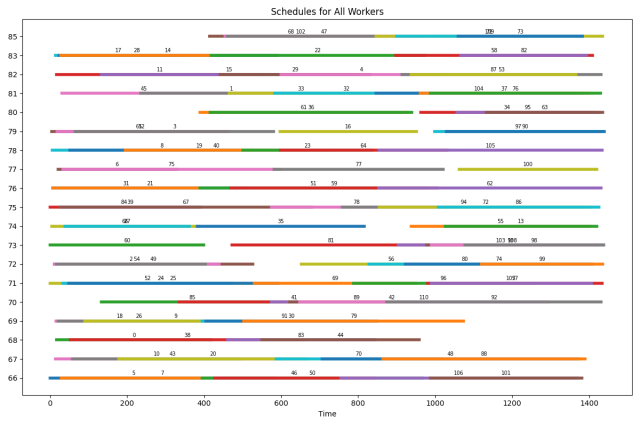
- Decision support: preserve candidate schedules in an external archive and inspect their trade-offs using Pareto plots, workload charts and worker timelines.
How the optimiser worked
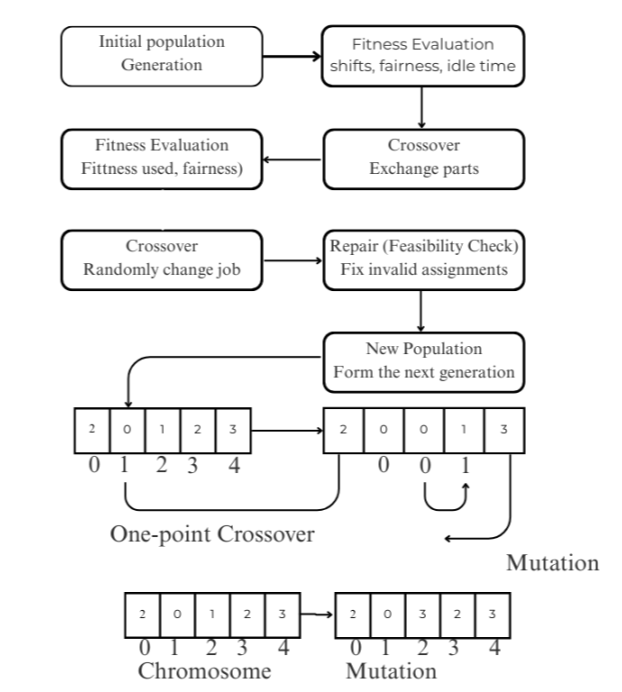
I represented each schedule as an integer list: the position identifies a job, and the stored value identifies its assigned worker. This kept the representation compact and made job-to-worker assignments directly available to the fitness function.
The public code samples parents at random, applies one-point crossover and mutates assignments using qualified workers. It selects non-dominated candidates and fills remaining population slots randomly. Its fitness function combines active-worker count and task-count imbalance with penalties for qualification violations and idle time.
I maintained a dynamic external archive of non-dominated candidates found throughout the run. This preserved useful alternatives beyond the final generation. The archive represents solutions found by the search; it does not establish global optimality.
From benchmark files to interpretable outputs
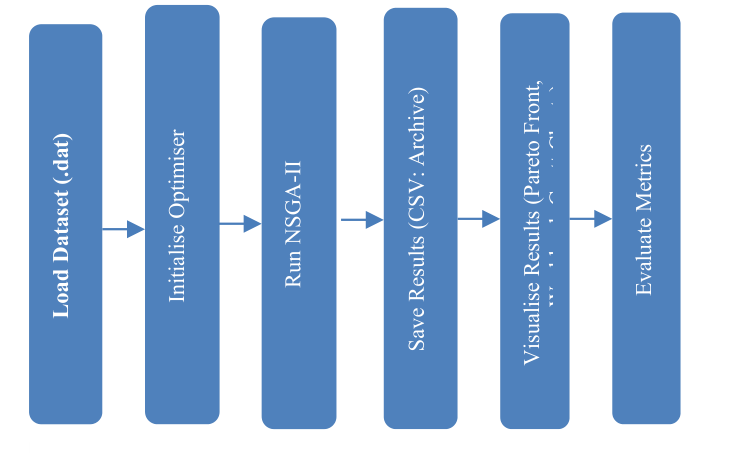
The report describes a configuration using a population of 100, 50 generations, a mutation rate of 0.1, an idle-time weight of 0.1 and a constraint-penalty weight of 1000. The public code's main script uses a penalty weight of 200. The report also compared a population of 200 with 100 generations.
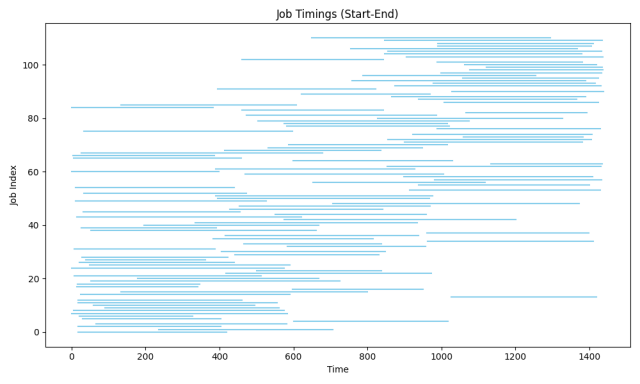
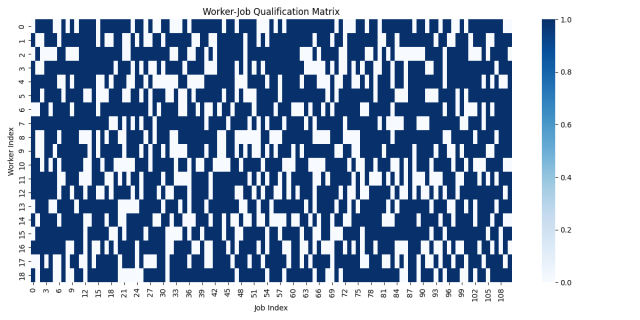
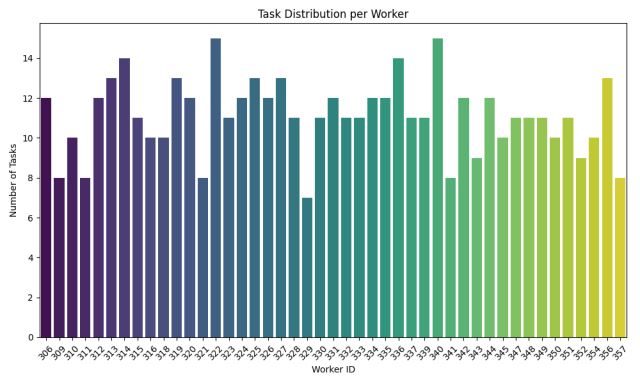
Job spacing and worker eligibility shaped the search problem. The original figures below illustrate the timing window and qualification structure of the smaller benchmark instance.
What the reported comparisons show
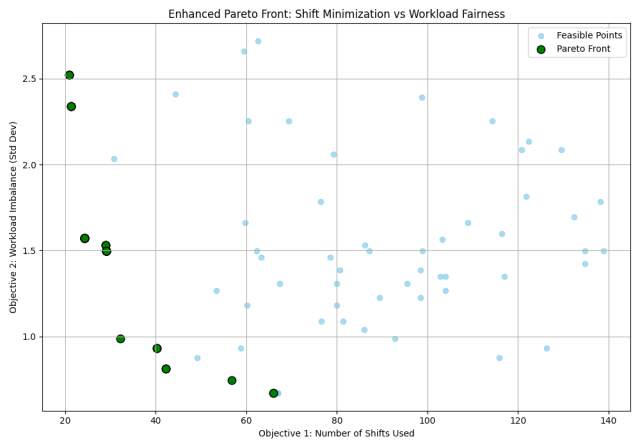
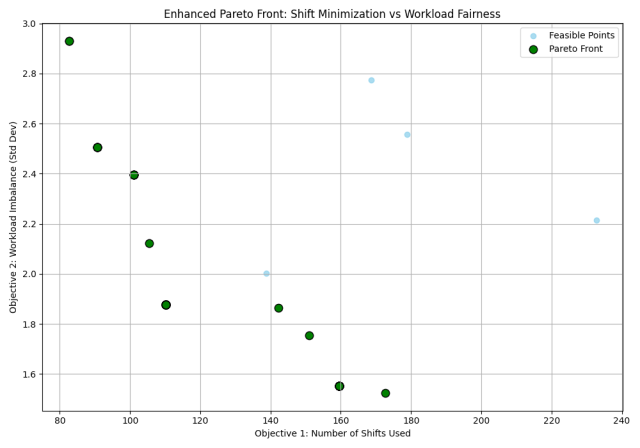
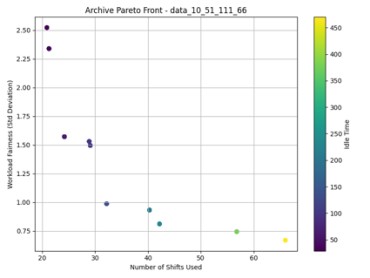
The report labels the Pareto axes as shifts used and workload imbalance. In the available public code, the value labelled shifts used includes qualification and idle-time penalties, so it is not necessarily a raw worker count. The code and the run behind the report figures need to be reconciled before drawing precise conclusions from the axes. The archive plot adds idle-time information to the retained candidates.
All figures below are original report outputs. Select an image to inspect it at full size. The report and public code differ in selection and constraint handling. The public code uses a fitness-score threshold when reporting feasibility and does not explicitly check overlapping jobs, so the reported feasibility figures require independent validation.
| Instance | Population | Generations | Feasible (%) | Pareto front size | Fairness spread | Average idle time |
|---|---|---|---|---|---|---|
| Small | 100 | 50 | 100.0 | 78 | 1.622 | 242.26 |
| Large | 100 | 50 | 100.0 | 99 | 1.321 | 497.49 |
| Small | 200 | 100 | 100.0 | 200 | 0.693 | 632.43 |
| Large | 200 | 100 | 100.0 | 113 | 2.205 | 1293.66 |
Small: data_10_51_111_66.dat. Large: data_56_163_500_66.dat. Values are transcribed from the report. Feasibility refers to the listed summary outputs, and idle time uses the benchmark's time units.
More candidates did not mean every measure improved
The second configuration produced more Pareto candidates in both displayed instances: 78 became 200 in the smaller instance, and 99 became 113 in the larger one. Its reported average idle time was also higher in both instances. I therefore interpret the results as a change in the available trade-offs, rather than an overall improvement from increasing population and generations.
The reported fairness-spread measure changed differently by instance: it decreased for the smaller case and increased for the larger one. These selected runs support examining the objectives together and repeating experiments before treating one configuration as preferable.
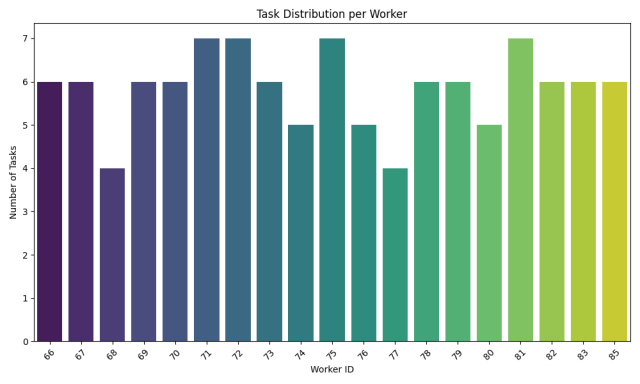
The Gantt chart makes the schedule inspectable: each bar shows a job assignment, while gaps expose idle periods. The activity charts provide another view of how active and idle time are distributed. These are example outputs from the report; the figures do not identify every run setting.
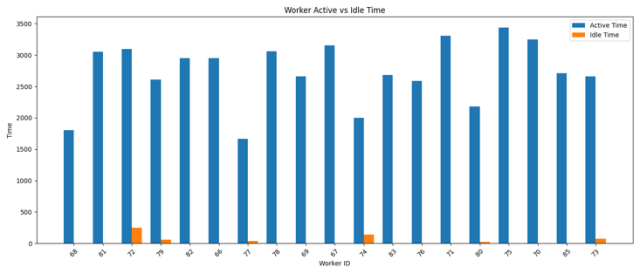
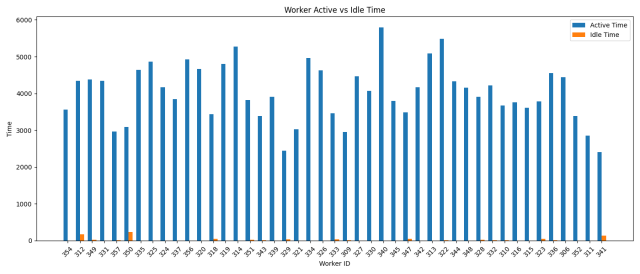
A practical challenge is ensuring that candidate assignments meet both worker qualifications and timing constraints. The public code checks qualification violations, but the available implementation does not explicitly test overlapping jobs. Independent feasibility checks are needed before treating a schedule as usable.
What I would improve next
- Repeated experiments: record random seeds, repeat each configuration and compare uncertainty as well as selected outcomes.
- Feasibility checks: explicitly validate overlapping jobs and worker qualifications, then assess or repair invalid assignments.
- Fairness definition: extend task-count balance to account for task duration, worker preferences and other practical requirements.
- Evaluation scope: test additional benchmark structures and validate the meaning of each metric before operational use.
The project strengthened my ability to connect algorithm design, constraints and visual analysis. Its output is a set of scheduling alternatives for benchmark problems; a production workforce-planning system would need further domain validation.
Project evidence
Individual report: MOGA Shift Minimization Task Report. Original figures 1-8 and summary Tables 2.1-2.2 are drawn from the submitted report. The public code differs from the report's description of tournament selection, crowding distance and repair. The reported figures have not been independently reproduced. Full source documents remain private.
The analysis here distinguishes reported experimental outputs from future deployment goals. No globally optimal schedule or measured operational saving is claimed.